Key takeaways
There is no independent concepts-per-month benchmark for Meta, especially below about $50k spend.
Size the pipeline from testing share of spend divided by the minimum you need to read one concept (The Social Outline works this at roughly £500 per concept on its own CPI assumption; Segwise relays a competing heuristic of about one new concept per $2,000 to 3,000 of monthly spend).
A new concept is a different argument, claim and proof structure; a variation is a different hook, edit, opener or format on the same argument.
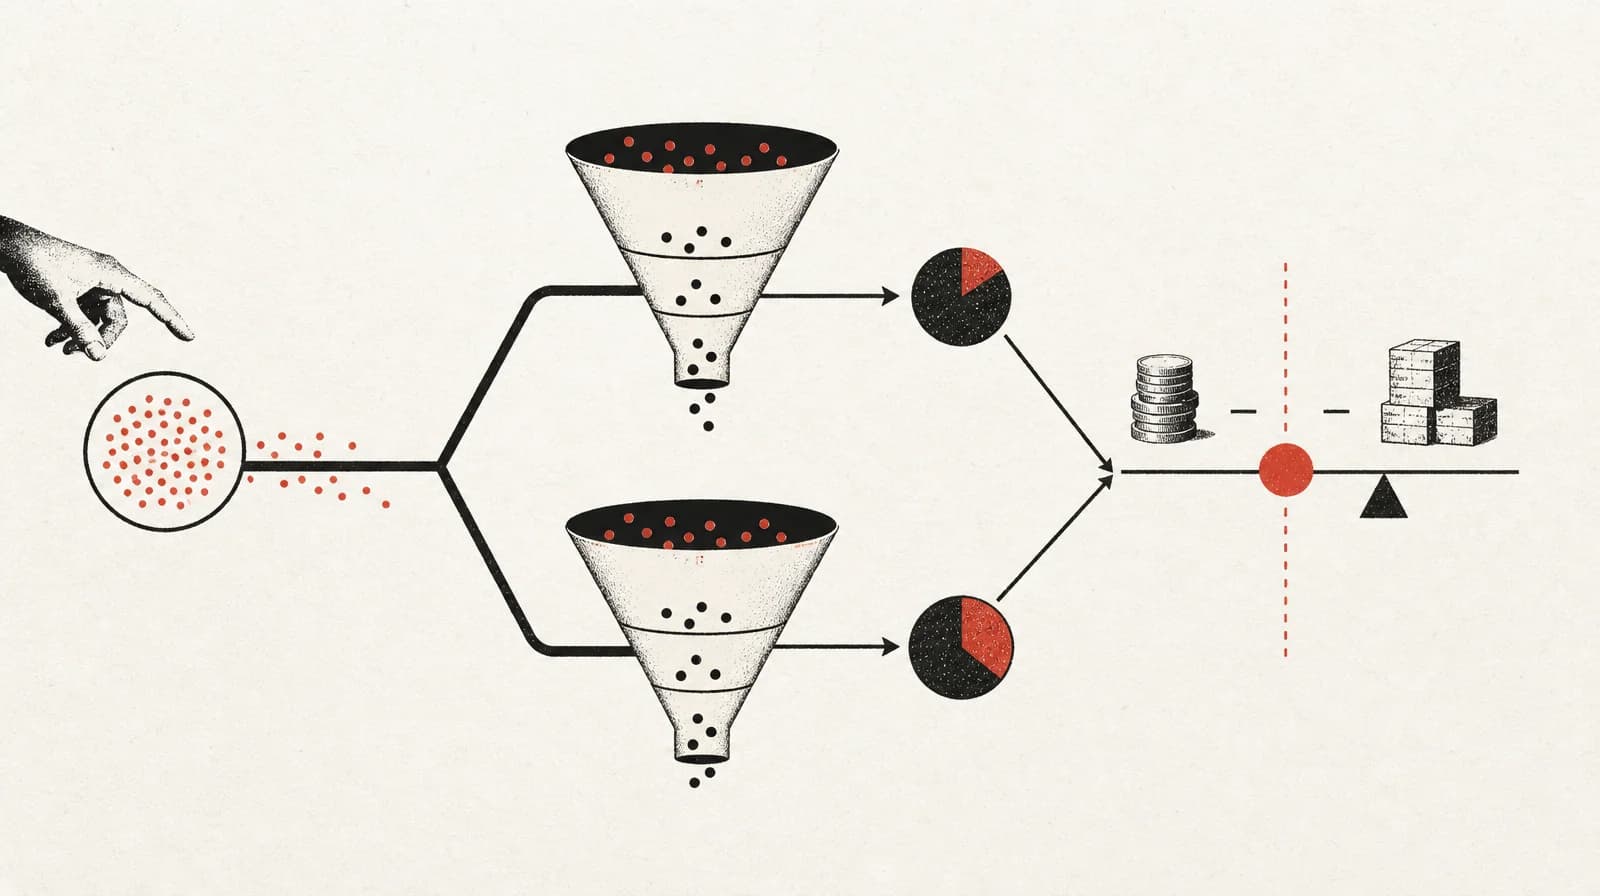
If results are worse than 2024 and nothing in the brief changed, run a four-rung ladder before you commission ads: compare your year-on-year CPM and CPA with published 2025 to 2026 movement, then Event Match Quality, pixel-versus-server gaps and deduplication, then fatigue only when two signals move together (frequency and first-time impression ratio on the exposure side), then retrieval collapse from a repetitive library.
Under about $500k a month, run a creative angle test before a geo holdout.
Treat Advantage+ Sales as the primary chassis only when weekly purchase volume is stable; the long-standing 50 conversions per week learning guidance and a reported drop to 25 are in conflict, and the 25 figure is unverified against a Meta announcement.
If the account is worse than 2024 and the brief has not changed, the next purchase order for ads is a decision, not a habit. The useful question is not how many new creatives a Meta account needs each month. It is whether the decline is the auction, the signal, saturation of the same people, or a library the retrieval system is collapsing into one idea. Rotation volume is what you commission after that ladder, not the policy you set before it.
Vendor playbooks still open with a count. Eight to twelve concepts, twenty-plus ads, refresh every two to three weeks. Those figures circulate because they are easy to staff against. They are not a reproducible read of what your account can clear, and they are a poor answer when the constraint is cost inflation or a broken purchase event.
What does a misread decline actually cost?
A wrong first move has a cash cost. Treat market-wide CPM inflation as creative failure and you pay a studio to replace ads that were never the constraint. Treat a tracking gap as fatigue and you retire winners while the optimiser keeps learning from a noisy event. Commission a geo holdout before you have readable concept tests and you can spend two to four weeks on a design that often cannot clear its own sample floor at mid-market budgets.
Scale on top of any of those and you magnify the system you already have. That is the same order of checks you want before increasing Meta ad spend: economics, measurement and creative supply, in that sequence, not a larger budget hoping the folder of new cuts will compensate.
The commercial pattern is familiar. Reported CPA drifts. Blended efficiency looks worse, which is why you still need to read MER beside contribution and mix rather than treating it as a creative KPI. The brand asks for fresh creative. Production fills the folder with new edits of the same argument. Delivery still concentrates. Next quarter's post-mortem cannot tell you which asset was even a separate idea.
That last failure is the expensive one. Fifteen variations of one idea and fifteen distinct angles can cost the same to test and are worth different amounts. The Social Outline makes that case as method, not as a win-rate study. If you cannot name the argument you retired, you cannot name the argument you still need.
Do volume quotas and calendar refreshes fix a declining account?
Most current results still sell a quota. Segwise recommends 8 to 12 conceptually distinct concepts per campaign, a Creative Similarity Score under 40%, and a refresh every 2 to 3 weeks. That is a prescription.
The calendar refresh is the quota's close cousin: replace the library because an interval elapsed. Confect asserts that effective ad lifespan compressed from 6 to 8 weeks pre-Andromeda to 2 to 4 weeks. There is no methodology or dataset attached. Treat it as a vendor assertion. Adsights notes that automated rules cannot compare against a trailing baseline, so they function as tripwires rather than diagnosis. A rule that kills ads at day ten is still not a read of fatigue.
The third habit is to name the algorithm first. Andromeda appears in the vendor literature as a retrieval story, and it may well be shaping how similar assets compete. It is also the explanation that is hardest to falsify from inside Ads Manager. Start there and you will skip the cheaper checks: auction movement you can compare with a public panel, and signal quality you can inspect in a morning.
Win-rate folklore does not rescue the quota either. Segwise relays a brkfst.io claim, across hundreds of accounts, that only about 2% of creatives tested become scalable winners. Elsewhere in the same corpus, batch-video win rates of 12 to 18% are repeated as if they described the same process. Those figures cannot both be a planning input. Present the conflict and plan from your own readable tests, not from a borrowed percentage.
Should you treat rotation as a policy, or as an output?
Quota thinking treats creative supply as the input that restores performance. Supply is expensive. It is only justified once you know which failure mode you are in.
Four rungs, cheapest first: auction-level cost inflation, signal quality, creative fatigue (exposure plus reaction), then retrieval-level suppression from a repetitive library. Only the last two rungs commission new work, and they commission different work. Fatigue wants executions that can reach people who have not seen the idea. Retrieval collapse wants arguments that can earn a separate entity, not another hook on the same claim.
Concept versus variation is about the argument, not how much you produced. A new concept is a different argument, aimed at a different buyer, with a different proof structure. A variation is another hook, edit, opener, or format on the same argument. For a one-hero-SKU brand the test is the same: a different persona or problem is a separate concept; a new format of the same idea is not. You still want format diversity so Meta does not treat every ad as the same creative. If the idea is weak, hook and format will not save it.
Recharm describes the retrieval mechanic behind that boundary: too-similar creatives are grouped under one entity ID and treated as a single concept, which reduces how many of your ads reach the auction. Recharm sells an asset-similarity scanning tool, so the diversity claim is commercially interested. Confect makes the same entity-ID point in different words: distinct creatives each receive their own retrieval chance, while one concept in many near-identical versions gets one chance. Attribute that mechanism to Confect, not to Meta.
Similarity-percentage cut-offs do not settle the definition. Segwise's under-40% guidance conflicts with widely circulated claims of a 60% suppression threshold. Neither is traceable to Meta documentation. Use the argument test on Monday. Leave the score to vendors until someone publishes a method.
How do you diagnose the decline, then size the pipeline?
- Compare your year-on-year CPM and CPA with published 2025 to 2026 movement before you blame the account.
- Audit Event Match Quality, pixel-versus-server gaps and deduplication before you retire winners.
- Call fatigue only when two signals move together, with frequency and first-time impression ratio on the exposure side.
- Inspect library repetition last: nothing spending is a different signature from everything decaying.
- Size next month from testing share divided by per-concept read cost, not from a quota.
Rule out the auction before you blame the account
Ryze's 2026 panel (dated April, updated June) is the dataset several other roundups cite, so treat it as one source, not corroboration by many. Average CPM up 20.1% from $11.82 to $14.19. CPC up 11.4% from $0.70 to $0.78. CPA up 38.1% from $27.66 to $38.19.
Direction is consistent across other 2026 panels. Magnitude is not. Other panels put median CPM near $13.48 and ecommerce averages as high as $16.80. One agency portfolio reported roughly 13% year-on-year CPM growth while country-level data reported roughly 12% for Tier-1 markets.
Compare your own year-on-year CPM delta with that band before you interpret CPA. If CPM moved with the market and CPA moved further, you still have an account problem. If both moved in line with the panel, "nothing changed" is not a creative story. It is a more expensive auction. Category spread in the same Ryze set (ecommerce CPA averaging $29.99, electronics $49.48) is a vertical caveat, not a target.
Rule out signal quality second, because it is cheap to check
A tracking fix changes reported performance and the optimiser's actual diet at the same time. That is why it sits above creative on the ladder. AdLibrary's diagnostic triggers are concrete: reported conversions exceeding server-side conversions by more than 15 to 20%, Event Match Quality below 6.0, CAPI missing or deduplication misconfigured. Check EMQ weekly as a leading indicator of signal health, not as a quarterly archaeology project.
Trackingplan reports 2026 Purchase-event benchmarks attributed to an Upstack Data analysis of over 50,000 ad accounts: average EMQ of 8.2 for CAPI-plus-pixel hybrid versus 5.1 for pixel-only. Second-hand attribution; the primary is not linked. Purchase events are scrutinised more heavily than low-value events, so weaker identifier sets hurt most where it matters. Do not generalise Trackingplan's single-brand case of a 25% attribution-accuracy uplift after raising EMQ from 5.2 to 8.1.
Confect claims pixel-only tracking penalises retrieval and that CAPI with correct deduplication improves how often ads clear the retrieval gate. Useful as a reason to order tracking before creative. The causal link is asserted, not evidenced. AdLibrary's claim that proper CAPI implementation can recover 15 to 30% of lost signal is attributed second-hand to Meta Business Help documentation. Do not repeat it as a measured recovery rate.
When EMQ looks healthy and pixel-versus-server purchase counts still diverge from the shop, do not treat the healthier Ads Manager number as the brief.
I would trust the business result over a healthy EMQ: contribution, blended MER, and the purchase count that matches the store. Pixel and server disagreeing is a measurement fight, not a creative win.
Do not scale on EMQ alone, and do not pick the healthier of pixel versus server until they reconcile.
Fatigue has a signature, and it needs two signals moving together
Adsights has the strongest methodological claim in this corpus: a fatigue diagnosis requires at least two signals moving together. Rising CPM alone can be an auction change. Falling CTR alone can be a placement artefact. Frequency and first-time impression ratio are exposure-side, closer to cause. CTR and CPM are reaction. CPA and ROAS confirm rather than detect.
The practical read Adsights offers: frequency past roughly 2.5 on prospecting, with first-time impression ratio trending down through roughly 50%, indicates delivery has shifted to re-serving a saturated core. The source itself states the bands are operator consensus with soft boundaries. Quote the caveat with the numbers. Do not harden them into a rule.
AdLibrary's contrast is the one you want on the war-room wall. Fatigue presents as climbing frequency with falling CTR and rising CPA, degrading gradually. A targeting or delivery problem presents as sudden CPM jumps, reach dropping, or delivery concentrating on a narrow slice. If the break is overnight, start with delivery and signal, not with a new concept sprint.
Retrieval suppression looks like nothing is spending
Recharm describes retrieval as a two-stage cut: hundreds of millions of ads narrowed to roughly a thousand candidates before a ranking model scores them. Use that only as a two-stage explanation. Combined with the entity-ID grouping claim, a repetitive library is a different failure mode from fatigue. Fatigue is decay on ads that still deliver. Retrieval collapse is ads that never get a separate chance.
That is why "we have plenty of ads in the account" is not a diversity argument. If they are executions of one claim, the retrieval story in this literature says they compete as one. Commissioning more hooks on that claim will not create more retrieval chances. Commissioning a different proof structure might.
Size rotation to spend, not to a monthly quota
Replace the quota with arithmetic. Testing budget share, times spend, divided by the minimum spend needed per concept for a readable result, equals the concepts you can actually run. The Social Outline uses a testing allocation of 15% of spend plus a per-concept minimum, worked at roughly £500 per concept on a £2 to 3 CPI assumption. That produces about 3 concepts at £10k a month, about 7 at £25k, about 15 at £50k. The arithmetic is the useful part. The CPI assumption is the source's own.
When the live account is missing target, that sum is not a ring-fence. Volume follows signal. If the offer is not buying, a standing share-of-spend rule for new-concept tests is the wrong policy. A small named test budget is fine. The arithmetic still tells you how many concepts you can actually read. It does not force you to spend that share just to look busy.
As practice, not a measured house result: volume follows signal, not raw output. You can make 100 ads. If none of them work, you made 100 ads for no reason.
The per-concept minimum does not fall as budget grows, so quotas do not scale linearly. The same "eight concepts" target is affordable at one spend level and impossible at another. Segwise relays a competing anchor, attributed second-hand to an MHI Media analysis of 80 DTC accounts: roughly one new concept per $2,000 to 3,000 of monthly Meta spend. Second-hand attribution. No independent benchmark in this pack covers sub-$50k accounts. Use both figures as planning fences, then run the sum on your CPI and your testing share.
Variation ratios in the same Segwise piece are heuristics, not findings: 2 to 3 hook variations per video concept, 5 to 8 variations per static concept. Budget split suggestion: 70 to 80% of budget to scaling winners, 10 to 20% to testing new creative. New concepts carry more risk and more upside than iterations. A pipeline needs both. That supports versioning. It does not tell you the mix for a single SKU brand with one proof.
ROAS on the winner is still not the business decision. Once a concept is readable, whether paid media should optimise for ROAS or profit is a separate control. Do not let a testing quota inherit a ROAS target that the contribution maths cannot support.
If you spend under about $500k a month, run the angle test first
Incrementality work is not the first diagnostic at this spend. AdBeacon cites a commonly used floor of roughly 200,000 users per group for statistical power, with a 2 to 4 week minimum window to capture delayed conversions. The source characterises this as "most guidance", not its own measurement. That rules out very small accounts. It is within reach of mid-market ecommerce running meaningful prospecting volume.
When the addressable audience cannot clear that floor, AdBeacon positions a geo holdout as the more accessible alternative: suppress campaigns in matched markets rather than splitting users. That design still needs matched markets and a clean pre-period. It is not a free substitute for a powered user split. Meta's Conversion Lift handles randomisation, holdout creation and lift calculation inside Ads Manager, which removes some operational load. It does not remove the sample requirement.
Sequence for this band: concept and angle tests first, because those results change what you produce next week. Holdout later, as a calibration exercise once the pipeline is producing readable winners. If you reverse that order, you will still not know which argument to put into the next flight.
When does Advantage+ become the primary chassis?
Do not pick a single weekly purchase number and pretend the corpus agrees.
Visible Factors states Advantage+ Shopping was renamed Advantage+ Sales in February 2025 and the legacy format was deprecated at API level through Q1 2026, with a cut-off across all versions on 19 May 2026. Legacy campaigns may still deliver but cannot be created or structurally edited. Those dates come from that source, not from a Meta changelog in this pack. Search for Advantage+ Sales. Do not keep briefing against a campaign type you can no longer build.
The same source states Meta guidance points to roughly 50 conversions per week per ad set for the learning phase to settle, and that the format allows up to 150 ads total at 50 per ad set. It also argues manual ABO remains correct for margin-sensitive lines, retention kept separate from acquisition, new geos, and launches that need guaranteed spend.
1clickreport claims the Advantage+ Shopping/Sales threshold was lowered from 50 to 25 conversions per week (and app campaigns from 50 to 15), attributed to Andromeda extracting more signal from smaller datasets. There is no link to a Meta announcement in the result. Treat it as unconfirmed and hold it against the 50/week guidance. The same article's worked example, a $40 AOV and $25 CPA store qualifying at roughly $90/day rather than $180/day, is illustrative arithmetic, not observed data. Even there, below 25 conversions a week performance is described as inconsistent, with manual preferable. Meta's own marketing claim of 17% more purchases per dollar versus manual campaigns recurs across results. It is still marketing data.
Decide from whether weekly purchase volume is stable, not from one week clearing a line. If volume wobbles around either threshold, Advantage+ as the primary structure is still a hope. That is also why Advantage+ Sales should not be the primary chassis below a stable 50 purchases a week. Fifty is the threshold in the question, not a house measurement. Below that pace the model is data-starved. Until the account is already buying, keep learning on a simpler campaign rather than handing a shopping mode a conversion stream it cannot feed.
Which thresholds in this market are actually evidenced?
Publish the confidence level with the number, or do not use the number.
Supported well enough to operate on, with the caveats already named: Ryze's year-on-year CPM/CPC/CPA movement as one panel; Adsights' two-signal rule and the soft frequency / first-time impression bands; AdLibrary's fatigue-versus-delivery contrast and the EMQ / gap / deduplication tripwires; Trackingplan's hybrid-versus-pixel EMQ averages as second-hand but large-sample; The Social Outline's testing-share arithmetic; AdBeacon's holdout floor as "most guidance"; Visible Factors' naming and 50/week learning note.
Not supported as measured fact: Andromeda-attributed lifespan compression from 6 to 8 weeks to 2 to 4 weeks; any Creative Similarity Score cut-off; the reported drop of Advantage+ learning from 50 to 25 conversions a week; a 2% versus 12 to 18% creative win rate as if they described one process; CAPI recovering 15 to 30% of lost signal as a rate you can forecast.
No independent audit in this pack shows that Andromeda shortened asset life. No reproducible source gives a similarity threshold. Most volume and ROAS uplift figures are agency- or vendor-reported with undisclosed methodology. That is the honest limit of the public evidence. It is also why a calendar refresh is a weak policy: you would be staffing against assertions.
What do you log so the next decline is cheaper to read?
This last piece is Penang Media operating practice, not a finding from the dossier.
We name every creative by idea, hook and format, plus production metadata, so we can pull everything with this hook or this format later. The concept is the trunk. Hook and format are branches.
That is the lineage that makes a retirement diagnosable six weeks later. A separate concept-ID scheme that has not been published is not the house system. Log launch date, retire date, and the diagnosis attached to the retirement: auction, signal, fatigue, retrieval collapse, or simply unread. If you cannot say why an asset left the account, you will commission its twin.
This week's action is the ladder in order, on the live account, before the next production brief. Write down your year-on-year CPM delta against the Ryze band, this week's EMQ and server-versus-reported gap, frequency and first-time impression ratio on the prospecting ads that still spend, and whether the library is many entities or one idea with costumes. Then size next month from testing share divided by per-concept read cost. If that sum is two concepts, brief two arguments, not twelve cuts.
Sources
- Meta Andromeda - The ultimate guide to Meta Ads in 2026 (Confect.io, dated March 2026) confect.io Distinct creatives each receive their own entity ID and retrieval chance; near-identical versions of one concept get one chance. Attribute to Confect, not Meta.
- Meta's Andromeda Needs Creative Diversity (Recharm, dated June 2026) recharm.com Retrieval narrows hundreds of millions of ads to roughly a thousand candidates before ranking. Use only for the two-stage explanation.
- Meta Andromeda Update 2026: Creative Strategy Playbook (Segwise, dated July 2026) segwise.ai Recommends 8–12 conceptually distinct concepts per campaign, Creative Similarity Score under 40%, refresh every 2–3 weeks. Prescription, not finding.
- Creative Fatigue in Meta Ads: Detection Thresholds & Fix Playbook (Adsights, dated July 2026) adsights.ai Fatigue diagnosis requires at least two signals moving together; rising CPM or falling CTR alone are insufficient.
- Meta ads testing budget: how much to spend testing each creative concept (The Social Outline) thesocialoutline.com 15% testing allocation plus a per-concept minimum, worked at roughly £500 per concept on a £2–3 CPI assumption: about 3 concepts at £10k/month, 7 at £25k, 15 at £50k.
- How Many Ads to Produce Per Month: A Budget Framework (Segwise, dated March 2026) segwise.ai Second-hand MHI Media heuristic: roughly one new concept per $2,000–3,000 of monthly Meta spend across 80 DTC accounts.
- Meta Campaign Optimization Challenges 2026: Diagnostic Framework (AdLibrary, dated April 2026) adlibrary.com Fatigue: climbing frequency, falling CTR, rising CPA, gradual. Delivery problem: sudden CPM jumps, reach dropping, or narrowed delivery.
- Boosting Your Meta Event Match Quality Score (Trackingplan, dated May 2026) trackingplan.com 2026 Purchase EMQ averages attributed to Upstack Data across 50,000+ accounts: 8.2 hybrid versus 5.1 pixel-only. Primary not linked.
- How to Run Your First Meta Ads Holdout Test (AdBeacon) adbeacon.com Commonly cited floor of roughly 200,000 users per group and a 2–4 week window, characterised as most guidance, not AdBeacon's measurement.
- Meta Advantage+ vs. Manual ABO: A Playbook To Scale past $100K (Visible Factors, dated June 2026) visiblefactors.com Advantage+ Shopping renamed Advantage+ Sales in February 2025; legacy format reported deprecated through Q1 2026 with a 19 May 2026 cut-off. Dates are this source's, not a Meta changelog in the pack.
- Advantage+ Shopping 25-Conversion Rule 2026: Setup Guide (1clickreport, dated April 2026) 1clickreport.com Claims the threshold fell from 50 to 25 conversions per week (app 50 to 15). No Meta announcement linked. Treat as unconfirmed against S10.
- Meta Ads Benchmarks 2026: CPM, CPC, CPA & CTR by Industry (Ryze, dated April 2026, updated June 2026) get-ryze.ai Year on year: average CPM up 20.1% from $11.82 to $14.19, CPC up 11.4% from $0.70 to $0.78, CPA up 38.1% from $27.66 to $38.19.