Key takeaways
CVR, CTR, CPA and ROAS are diagnostics, not verdicts.
Each carries a denominator, an attribution window, and an unstated target.
Break-even is the decision line: CPA (AOV times contribution margin), or ROAS/MER (1 divided by contribution margin, measured before marketing).
Above it, the blended account holds contribution profit, but scaling further needs the incremental return checked too.
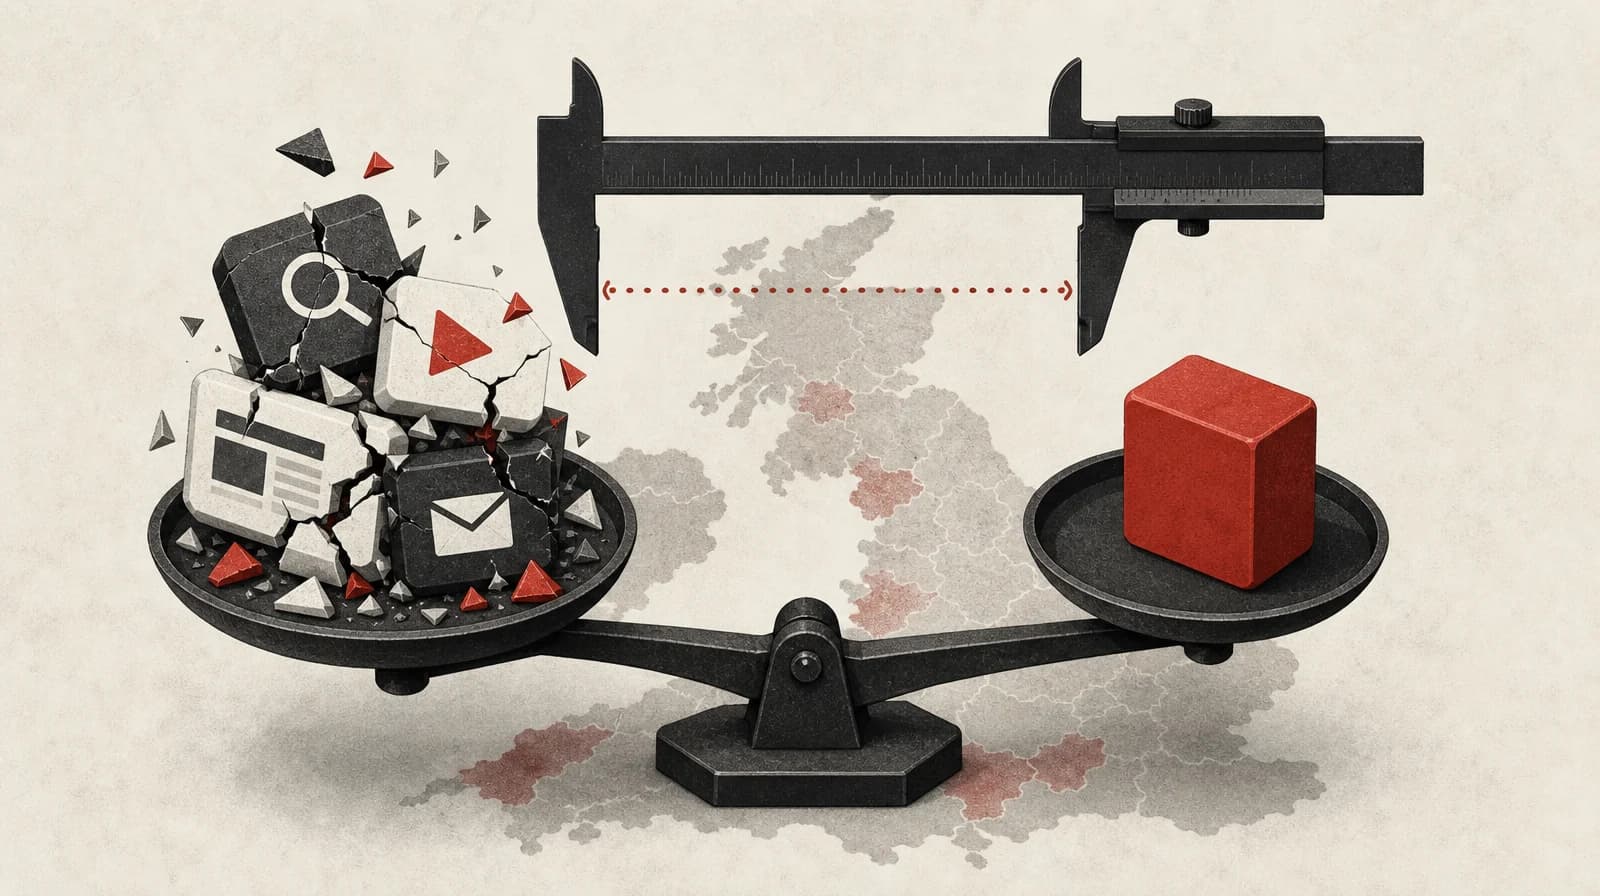
Before you increase budget, pause a campaign or declare a test won, someone in the account has to point at a specific number and say why. Most of the numbers on a paid-media dashboard are not built for that job. Conversion rate, click-through rate, cost per action and ROAS all measure something real, but each one carries a denominator, a time window and an implicit target that the interface never states. Read them without checking those three things and you can talk yourself into cutting a campaign that is working and scaling one that is not.
This is a working reference for the metrics that get argued about in a Meta or Google Ads review: what each one can and cannot tell you, and where the threshold that should decide spend actually comes from.
The same word means different things on different dashboards
Conversion rate is the clearest case. Google Ads Help defines it as conversions divided by total eligible interactions, excluding clicks that cannot be tracked from the denominator, and it defines cost per conversion the same way one level up: total cost divided by the conversions column, again after removing untrackable interactions (Understand your conversion tracking data). A 21-store Shopify benchmark panel defines conversion rate differently: orders divided by sessions, computed from Shopify's own sessions table rather than a visitor count (DTC Pages' 2026 ecommerce conversion rate benchmark). Those are not the same fraction. Picture a campaign reporting a 3% conversion rate in Google Ads next to a store benchmarked against that same panel's median CVR of 2.07%. Neither number is wrong, but comparing them directly compares two different fractions labelled with the same word.
ROAS has the equivalent trap. The platform version, which Google calls conversion value per cost, is total conversion value divided by total cost of ad interactions (Conversion value per cost: Definition). It is a delivery metric: it tells you what the auction believes it delivered, using whatever attribution rules and conversion set were configured. It says nothing about product cost, discounting or returns, so it is not automatically the ROAS the business needs to break even on.
Click-through rate answers a narrower question honestly. It is clicks divided by impressions, a measure of whether the ad stopped the scroll. It says nothing about the landing page, the offer or the margin, and no study cited here links it to either. Treat CTR as a creative diagnostic that feeds decisions covered in how many new Meta creatives you actually need each month, not as a number that should move budget on its own.
The attribution window sitting inside every CPA and ROAS figure
Even once the denominator is fixed, the window that produced the numerator changes the number again. Meta's attribution setting for a website conversion ad set can combine a click-through window with shorter windows for other engagement types, and the exact combination depends on how the individual ad set is configured, so check the setting directly rather than assume a fixed default.
Practically, that means a CPA or ROAS pulled from Ads Manager already has some click credit and some view credit baked in before you see it. Two accounts on different windows are not comparable, and neither is the same account before and after a window change. A guide to Meta's attribution settings puts it plainly: never compare a 7-day click account against a 1-day click account, and log the date of any attribution setting change so analysis does not silently cross it (Meta ads attribution settings comparison guide). Meta's own Compare Attribution feature lets you view multiple windows side by side, which is the fastest way to check before assuming one number represents the account. Reading a shorter window such as 1-day click strips out some of the organic-intent noise that a longer window carries, which makes it a cleaner lens for reading a test's reported numbers. That is a narrower claim than saying it replaces a randomized incrementality test: a genuine holdout, where a portion of the audience is deliberately withheld from the ads, measures something an attribution window cannot, however short that window is set.
A longer window will generally credit more conversions than a shorter one, so a 7-day click account should read a lower CPA and a higher ROAS than the same account measured on 1-day click. None of the sources behind this piece quantify how large that gap typically runs for a D2C account, so treat any specific percentage someone quotes you as unverified until you check Ads Manager's Compare Attribution view for that account directly.
The only number worth arguing about is break-even
CVR, CTR, CPA and platform ROAS all describe what already happened in the account. None of them tells you whether it should spend more, less or the same next week. That answer comes from a threshold you calculate, not one you look up. Contribution margin is contribution profit (revenue after product cost, discounts, shipping, payment fees and expected returns) expressed as a percentage of revenue.
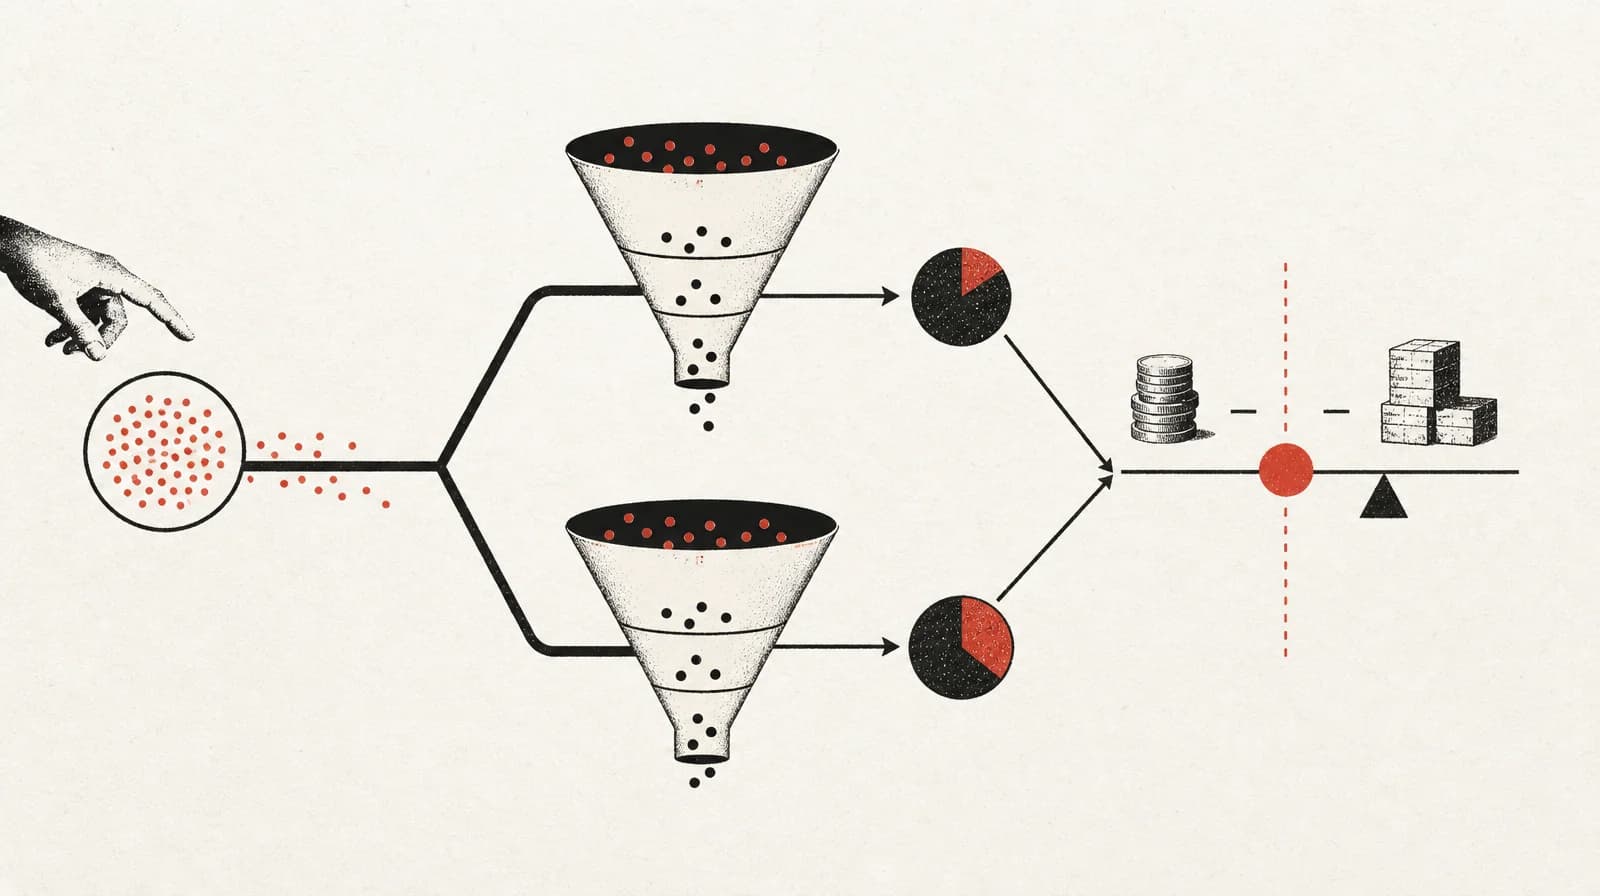
Break-even ROAS is 1 divided by contribution margin. At a 30% contribution margin, that is 3.3x (Eightx's break-even ROAS arithmetic). Break-even MER, marketing efficiency ratio (total revenue over total marketing spend), follows the same arithmetic at account level, measured against contribution margin before marketing: 2.50x at a 40% margin, 2.22x at 45%, 1.82x at 55% (Eightx on blended ROAS versus break-even MER). Both figures assume the margin percentage holds steady as spend changes and that the return being measured is the incremental result of the next pound of spend, not the account's blended average. Below the break-even line under those assumptions, every extra pound of spend loses money for the business, unless the plan explicitly bets on future repeat purchase covering the gap. Above it, spend adds contribution profit as well as revenue, but that is a statement about the blended account, not proof that the next pound in particular will pay back at the same rate: fixed overhead still sits above the line and the marginal return still needs checking.
Cost per action converts the same arithmetic into a currency figure. Assuming one order per conversion, break-even CPA is average order value multiplied by contribution margin: the CPA at which that single order's profit is exactly zero. A CPA below that number is profitable on the first order. A CPA above it is not automatically wrong, but it needs a stated reason: a deliberate new-customer acquisition play, or a subscription model backed by a lifetime-value calculation someone has actually modelled rather than assumed.
One agency convention is worth naming as just that, a convention rather than a rule: some operators target 20 to 50% above their calculated break-even to cover overhead and measurement noise, per the same break-even ROAS piece cited above, which presents the range as common operator practice rather than a tested rule. Use it as a starting buffer, not a benchmark to defend in a board pack.
What industry benchmarks can and cannot tell you
Reported average ecommerce conversion rates for 2026 do not agree with each other, and the disagreement is informative rather than noise. The DTC Pages panel, a 21-store, 417 million dollar revenue sample, found a median CVR of 2.07% in Q2 2026, and its most useful finding was that average order value, not industry vertical, was the strongest predictor: stores under 60 dollars AOV had a median CVR of 2.42%, stores above 200 dollars AOV had a median of 0.79%. Propel Commerce's 2026 conversion-rate roundup makes a narrower point: published averages disagree mainly because the underlying sources count, sample and define a conversion differently. It cites IRP Commerce's July 2026 category figures, which range from 5.23% in arts and crafts down to 0.55%, as an example of how far the number moves once you change the category set and the source.
Neither piece tested its claim against the other's dataset, so read them as two separate observations rather than a settled disagreement. The practical implication for a media-buying decision holds either way: a published average CVR is not a target. The same Propel Commerce piece notes a 1.5% CVR store at 200 dollars AOV and a 3% CVR store at 80 dollars AOV can carry comparable unit economics. Calculate your own break-even CPA (AOV times contribution margin) and compare your actual CPA against it, rather than trying to benchmark CVR directly: a true break-even CVR would also need your cost per click or cost per matching session, and most published benchmarks don't disclose the traffic cost that would make a direct comparison valid. Treat every benchmark figure by its stated population and window rather than as an industry constant. None of the figures above are UK-specific: the benchmarks cited here are global or US-weighted, so a UK operator should read them as a rough anchor, not a local standard.
A short checklist before the next spend decision
- Confirm the denominator behind any CVR or CPA figure being quoted: eligible interactions, sessions, or a mixed conversion set.
- Note the attribution window the number was pulled under, and whether it changed recently.
- Calculate break-even CPA (AOV multiplied by contribution margin) and break-even MER (1 divided by contribution margin) before judging any reported figure against it.
- Treat CTR as a creative signal that feeds a rotation decision, not a spend decision on its own.
- Read the account-level number, not the ad-level one, before deciding to add budget.
The checklist assumes someone owns the calculation and writes the threshold down before the review, not during it. Before adding budget on the back of a strong ROAS, it is also worth checking the account's supply side, covered in what to check before increasing Meta ad spend.
Do not confuse a stopped test with a clear signal
Creative and audience tests need the same underlying discipline, for a different reason: the temptation is to stop a test the moment a variant looks like it is winning. Checking a test repeatedly and stopping at the first favourable reading quietly multiplies false winners. A test stopped on its best daily reading ships false winners several times more often than the stated confidence level implies (Clean Digital's ad test significance guidance). Sample size should be decided before the test launches, not adjusted once the data starts looking good. If the account cannot fund the sample size a meaningful lift would require, the fix is a bigger creative difference between variants, not a shorter test.
Reading Meta's learning phase calls for similar scepticism. A review of Meta's own documentation found it inconsistent about the threshold: one page describes roughly 50 optimisation events since the last significant edit, another roughly 50 optimised conversion events per ad set (Meta ads learning phase reset). Treat "around 50" as an approximate signal that an ad set has enough data to read, not a precise gate, and be sceptical of any "50 per week" framing presented as the rule rather than a corollary of it.
Sources
- Understand your conversion tracking data - Google Ads Help support.google.com Conversion rate is conversions divided by total eligible interactions, excluding untrackable clicks from the denominator.
- Conversion value per cost: Definition - Google Ads Help support.google.com Conversion value per cost is total conversion value divided by total cost of ad interactions, an ROI estimate distinct from break-even ROAS.
- Meta Ads Attribution Settings 2026: 7-Day Click, Engage-Through & Incremental Attribution karb.ai Supports, with the publisher's own hedge, that for a typical website conversion campaign in 2026 Meta's default attribution setting can include 7-day click-through, 1-day engage-through and 1-day view-through; the page adds that advertisers should verify the setting in the individual ad set because options depend on campaign configuration.
- Meta ads attribution settings comparison guide jetfuel.agency Never compare accounts on different attribution windows; log the date of any window change.
- What is ROAS? The definition, formula, and the break-even number your margin demands | Eightx eightx.co Break-even ROAS is 1 divided by contribution margin; at a 30% contribution margin the line is 3.3x, and Eightx attributes that formula to Cometly, QRY and DTC finance practitioners generally, so it is not a claim unique to this page.
- Blended ROAS vs breakeven MER: is your ad engine profitable? | Eightx eightx.co Page states breakeven MER equals 1 divided by contribution margin measured before marketing, giving 2.22x at a 45% margin.
- Ecommerce conversion rate benchmarks 2026 dtcpages.com 21-store, $417m-revenue Shopify panel with median CVR of 2.07% in Q2 2026.
- Average ecommerce conversion rate, 2026: the actual numbers by industry | Propel Commerce propelcommerce.io The piece is a roundup of third-party benchmarks, not an original study: it reports roughly 2.2% global from IRP Commerce (July 2026, global tracked sectors) and 1.4% Shopify-specific from Littledata's benchmark of 2,800 sites, with a good Shopify rate given as 3.2%+ (top 20%).
- Ad test significance calculator and guidance cleandigital.co.uk Repeatedly checking a test and stopping at the first favourable reading multiplies false winners beyond the stated confidence level.
- Meta ads learning phase reset scalemate.co Reports inconsistency in Meta's own documentation of the learning-phase threshold: roughly 50 optimisation events since the last significant edit versus roughly 50 optimised conversion events per ad set.