Key takeaways
Marginal MER is the change in revenue divided by the change in spend, on UK revenue excluding VAT.
Compare two spend plateaus, not adjacent weeks.
Break-even MER is 1 divided by contribution margin before ads, after product cost, fulfilment, payment processing and returns.
The ratio is not causal, and it only describes spend already run.
Marginal MER from your own rows
Marginal MER, from your own weekly rows, is the change in revenue divided by the change in spend. For a UK report, exclude VAT from revenue. Qwestyon states the convention as total revenue excluding VAT divided by total marketing spend.
Keep both rows on the same spend definition. Published definitions already disagree. Platform DTC uses advertising spend across channels. Darkroom counts media, agency fees, creative production and affiliate costs. The costs you include change the delta. A retainer that lands in one week can become most of the change in spend, so the ratio describes an invoice. What belongs in a board-level total is a separate question: What actually counts as total marketing spend in a board-level MER report.
Google Meridian's mROI is a different object. The glossary describes it as the derivative of the response curve, approximately the return on the next monetary unit spent beyond the current spend level. Meridian defines ROI as incremental outcome divided by spend. Incremental outcome compares the actual result with a counterfactual in which the marketing activity never happened. The visualisation notes call mROI the predictive return on an additional unit spent. Those quantities come from a Bayesian media-mix model. Subtracting last week's revenue from this week's doesn't build that counterfactual.
Published pages split the name incremental MER. DTCo and ATTN Agency use the week-over-week change in revenue divided by the change in spend, and ATTN Agency calls the result iMER. Qwestyon uses the name for a holdout or a media-mix model, which asks whether the revenue would have happened without the marketing, and divides by total marketing spend. Below, marginal MER means the observed revenue change divided by the observed spend change.
The average does not price the next pound
Blended MER divides total revenue by total spend over the window you chose. Blended MER can stay high while the latest observed step has a lower ratio. The average is the slope from zero through the whole period. A slope between two spend levels you have already run describes that step. It does not price spend above the higher level.
The published decision rules don't agree. DTCo's condition is an iMER well above overall MER, which it treats as marginal dollars performing better than the baseline. ATTN Agency compares iMER with target MER, and says you likely have room to scale when iMER is above that target. Platform DTC's glossary sets the increment against break-even blended MER, the inverse of contribution margin before media. At a 45 per cent contribution margin before media, that line is 1 ÷ 0.45, or 2.22. Its example of $100,000 of revenue for $50,000 of spend is a marginal MER of 2.0, below that line. A marginal MER above blended MER can still sit below break-even, and a marginal MER below blended MER can still clear it. Use break-even MER to decide whether the step still contributes. The gap against blended MER only shows whether the step is flatter or steeper than the average.
Set the rows before you divide
Before you divide, lock the series:
- Exclude VAT on every UK week, not on a subset.
- Use one currency, one store and one week definition.
- Leave out weeks with a promotion or a known seasonal spike. A ratio won't strip that mix out.
- Use media spend if the decision is about media pounds. Keep agency retainers and one-off production invoices out of the weekly change.
Affiliates and creative production sit inside some board-level denominators, including the broad one Darkroom describes. Include them in this ratio only if they actually moved with the week you are judging.
Adjacent weeks make a bad slope
DTCo and ATTN Agency both print the adjacent-week version. It is a hard slope to read. Vexpower notes that marginal ROAS is a slope, and that slopes are harder to estimate than levels. In a Bayesian model, the credible interval on mROI is usually wider than the one on ROI. In a sheet, a small spend change does the same damage in plain sight: the denominator shrinks, and ordinary revenue movement dominates the ratio.
The weeks below are invented, in pounds, with revenue excluding VAT and media spend only. They exist so the arithmetic can be checked. They are not a store's results.
| Week | Media spend | Revenue excl. VAT | | --- | --- | --- | | 1 | £8,000 | £34,000 | | 2 | £8,200 | £31,200 | | 3 | £10,000 | £41,000 | | 4 | £9,600 | £40,500 | | 5 | £14,000 | £50,000 | | 6 | £14,200 | £56,000 | | 7 | £13,800 | £49,000 | | 8 | £16,000 | £54,000 |
Week 2 against week 1: spend rose by £200 and revenue fell by £2,800, so the ratio is -14. Week 3 against week 2: revenue rose by £9,800 on £1,800 of extra spend, a ratio of 5.44. Week 6 against week 5: £6,000 of extra revenue on £200 of extra spend, a ratio of 30. Week 7 against week 6: spend fell by £400 and revenue fell by £7,000, so the ratio is 17.5. That 17.5 is positive only because spend and revenue both fell. The pair describes a smaller week.
ATTN Agency recommends rolling 4-week and 13-week MER views. A rolling MER divides revenue in the window by spend in the window, which smooths the average and does not measure the increment. Averaging the adjacent ratios is no better: a ratio of -14 and a ratio of 30 are not two readings of the same step, and their average is not the slope between the low-spend weeks and the high-spend weeks.
The formula also pins this week's revenue change on this week's spend change. If the order arrives after the click, the pair is wrong. Meridian's response-curve page lists lagged effects as an interpretation consideration. Neither a minimum spend gap nor a set number of weeks of lag is established for this sheet. One adjacent week will not settle the next pound, and sliding revenue back by a week will not settle it either.
Compare two plateaus you have already run
Common Thread Collective says you will not know the marginal aMER for every cohort of spend. You can sample two points and read the delta. Their example steps from $1,000 a day to $1,500 and looks at the marginal aMER of that $500. Marginal aMER on that page uses new-customer revenue. The comparison below keeps the two-point idea and uses total revenue. If you need the new-customer version, keep that numerator throughout. Don't mix it with total revenue in one ratio.
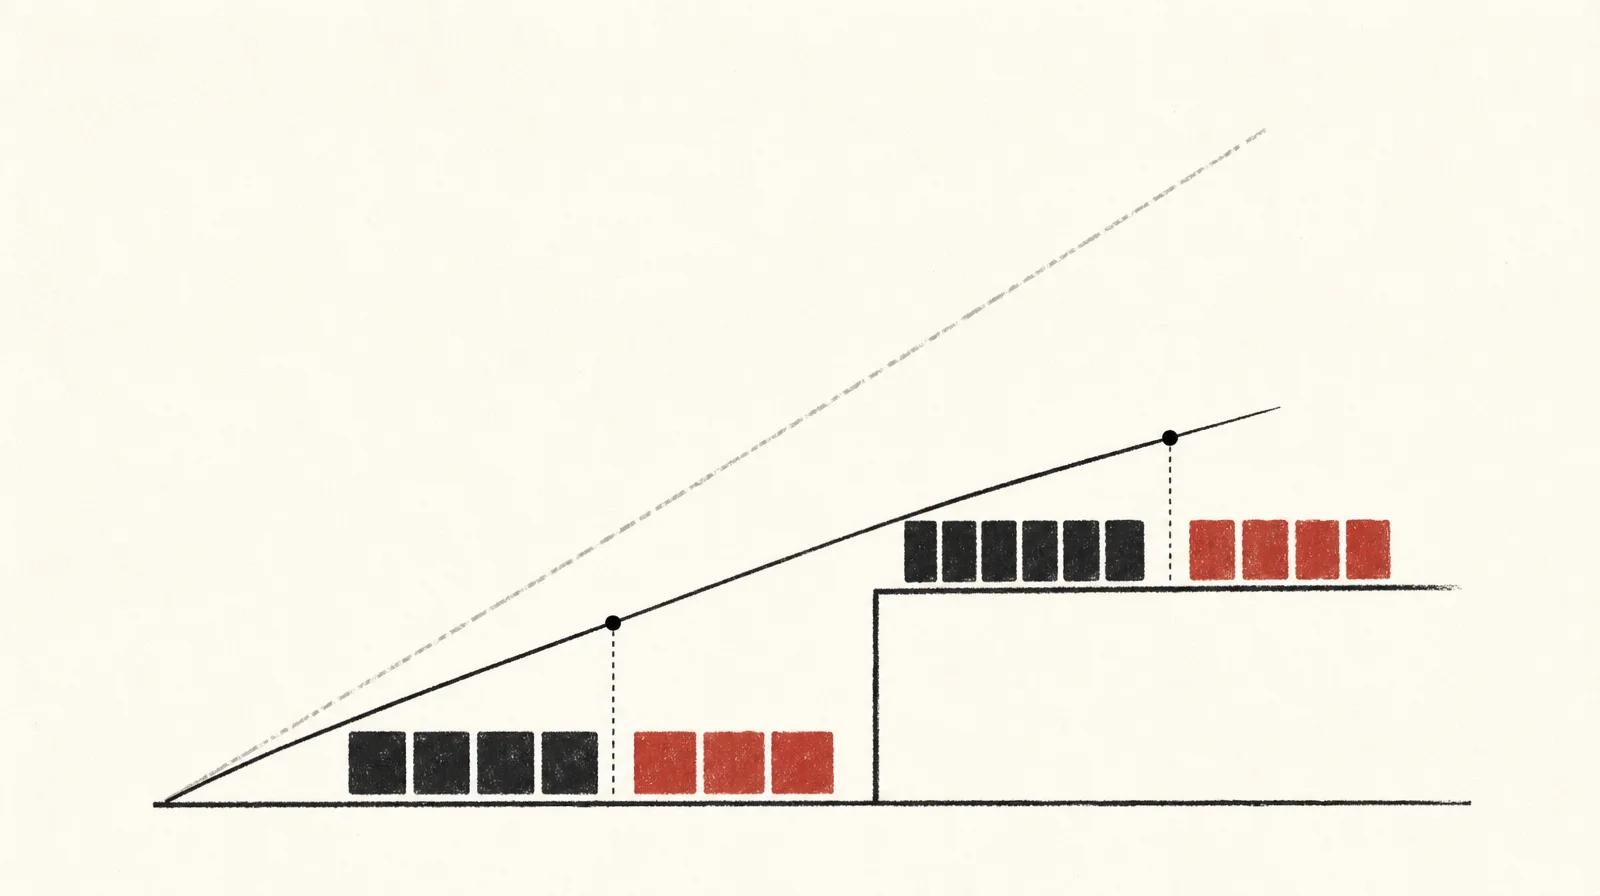
On the invented series, weeks 1 to 4 are the lower plateau: spend £35,800, revenue £146,700, blended MER 4.10. Weeks 5 to 8 are the higher plateau: spend £58,000, revenue £209,000, blended MER 3.60. Spend rose by £22,200. Revenue rose by £62,300. Marginal MER is £62,300 ÷ £22,200 = 2.81.
Average weekly spend moved from £8,950 to £14,500. The line between those midpoints is flatter than the line from the origin through the higher plateau. One line is the increment, 2.81. The other is the average at that higher spend, 3.60. Blended MER reports the steeper line.
Meridian assumes that paid and organic media have diminishing marginal returns, and that the media effect over a time period has an asymptotic limit. As spending increases along its response curve, mROI diminishes. That is a modelling assumption, not a finding from these eight weeks. A gap between 2.81 and 3.60 fits the assumption. Noise, mix and lag fit the gap too. Meridian's response-curve page reads a much lower mROI than ROI as the channel beginning to saturate at the historical spend level. The sheet has no separate check that turns 2.81 into that reading.
The same page assumes a constant cost per media unit, equal to the historical average cost per media unit. The 2.81 ratio uses the spend and revenue already recorded on each plateau, so it already includes the costs paid. That constant-cost assumption matters when you extrapolate past those weeks. If auctions were dearer on the higher plateau, part of the flatter revenue rise is a higher price per media unit.
Google's response-curve page flags extrapolation risk for incremental outcome estimates at points above historical spend. The 2.81 figure describes the step from £8,950 a week to £14,500 a week, not a week at £20,000.
Break-even is the profit line
Break-even MER, for this decision, is 1 divided by contribution margin before ads. Contribution margin before ads is revenue after cost of goods, fulfilment, payment processing and returns, and before advertising. Platform DTC uses that set of costs for contribution margin before media. Overheads sit outside it. Leave out a variable cost you do pay and the line moves. At 40 per cent, break-even MER is 1 ÷ 0.40 = 2.5. The 40 per cent is invented so the division is easy to check. Use yours.
On the plateaus, 2.81 is above the invented break-even of 2.5, so the observed revenue change covers contribution margin on the extra spend at that rate. The ratio sits below both plateau averages, 4.10 and 3.60. The comparison does not show that the extra spend caused the extra revenue.
Beating blended MER answers a different question, and it can give the opposite instruction. A second invented pair, again in pounds and excluding VAT: a base of £50,000 spend and £110,000 revenue, blended MER 2.2. The next step adds £10,000 of spend and £24,000 of revenue. Marginal MER is 2.4, above 2.2. At 40 per cent, the extra revenue keeps £9,600 before ads, against £10,000 of media, so the increment is £400 short of the line.
The reverse is the plateau result. Marginal MER of 2.81 sits below blended MER of 4.10 and above break-even of 2.5. Cutting because the increment is worse than the average would remove spend that still contributes. In the second pair, scaling because 2.4 beat 2.2 would add spend that still loses money.
Hold the observed range, or test
If your plateau marginal MER is above your break-even MER, the higher spend you have already run clears that line on the ratio, so you can justify holding it. The ratio does not show that the extra spend caused the extra revenue. A weekly spend the weeks never reached sits outside the estimate. If the figure is below break-even, the observed revenue change does not cover contribution margin on the extra spend. Noise, mix and lag can produce that result, so the ratio does not prove the extra pounds failed. Move back towards the lower plateau, or measure the step with a holdout or a media-mix model before you add budget.
Sources
- Google Meridian glossary developers.google.com mROI is the derivative of the response curve and is approximately the ROI on the next monetary unit spent beyond the current spend level.
- Google Meridian: Incremental outcome, ROI, mROI and response curves developers.google.com Google's own Meridian response-curve page lists extrapolation risk as a consideration for incremental outcome estimates at response-curve points above historical spend. The warning about going beyond observed spend therefore does not come only from Plaid Testing; Google's page states it directly.
- Google Meridian: Interpret the visualizations developers.google.com mROI is the predictive return on investment from an additional unit spent.
- Google Meridian Scenario Planner (Open Beta) developers.google.com The Target channel mROI option determines the maximum amount you can spend on each channel while still achieving a target minimum marginal ROI on each channel.
- Common Thread Collective: Marketing Efficiency Ratio commonthreadco.com Marginal aMER equals marginal acquired revenue divided by marginal ad spend. Acquired revenue on this page is new-customer revenue.
- Platform DTC glossary: What is MER? platformdtc.com Platform DTC defines contribution margin, for its contribution MER, as revenue minus cost of goods, fulfilment, payment processing and returns, before media.
- DTCo: Marketing Efficiency Ratio dtco.ai DTCo's condition is iMER that is well above overall MER, not just above it. That is the case it treats as marginal dollars beating the baseline. A small gap, such as 2.4 against 2.2, does not clearly meet the stated condition.
- ATTN Agency: Marketing Efficiency Ratio attnagency.com iMER equals (revenue this week minus revenue last week) divided by (spend this week minus spend last week).
- Darkroom: Marketing Efficiency Ratio darkroomagency.com The denominator can count media, agency fees, creative production and affiliate costs.
- Vexpower: Marginal ROAS (mROAS) vs average ROAS vexpower.com Marginal ROAS is a slope, and slopes are harder to estimate than levels.
- Plaid Testing: Marginal ROAS plaidtesting.com Plaid Testing paraphrases a modelling caveat: marginal estimates assume a constant cost per unit of media and grow less reliable beyond the spend levels already observed.
- Qwestyon: Marketing Efficiency Ratio guide for UK businesses qwestyon.com MER equals total revenue excluding VAT divided by total marketing spend, stated as a UK convention.