Key takeaways
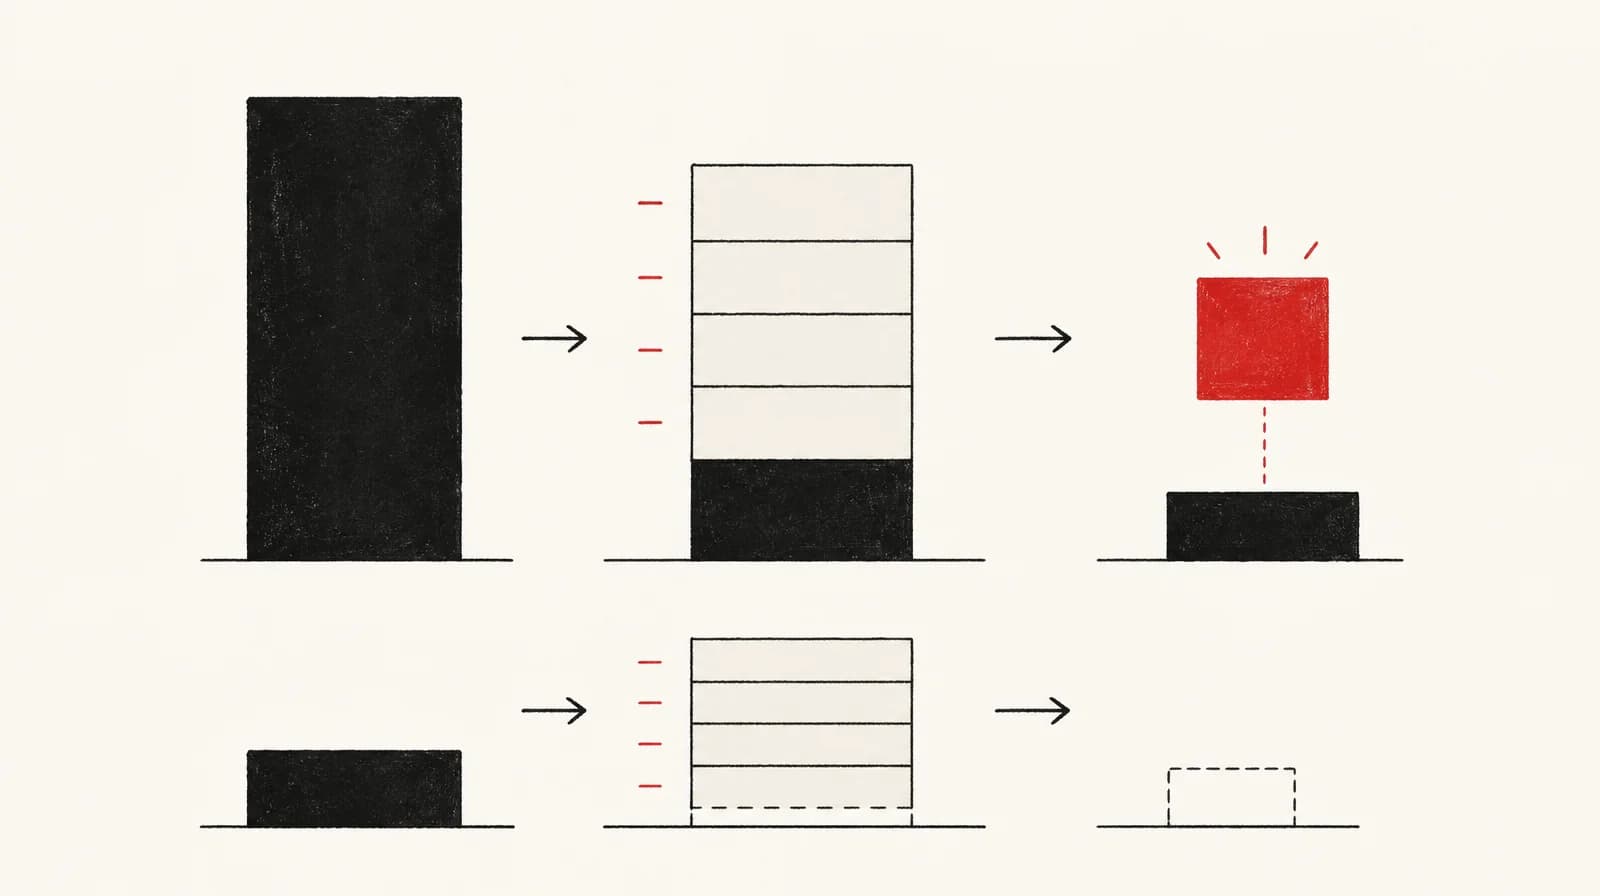
Rank each stage on a named horizon by the cash or contribution you can still change, and count a lead-time effect once.
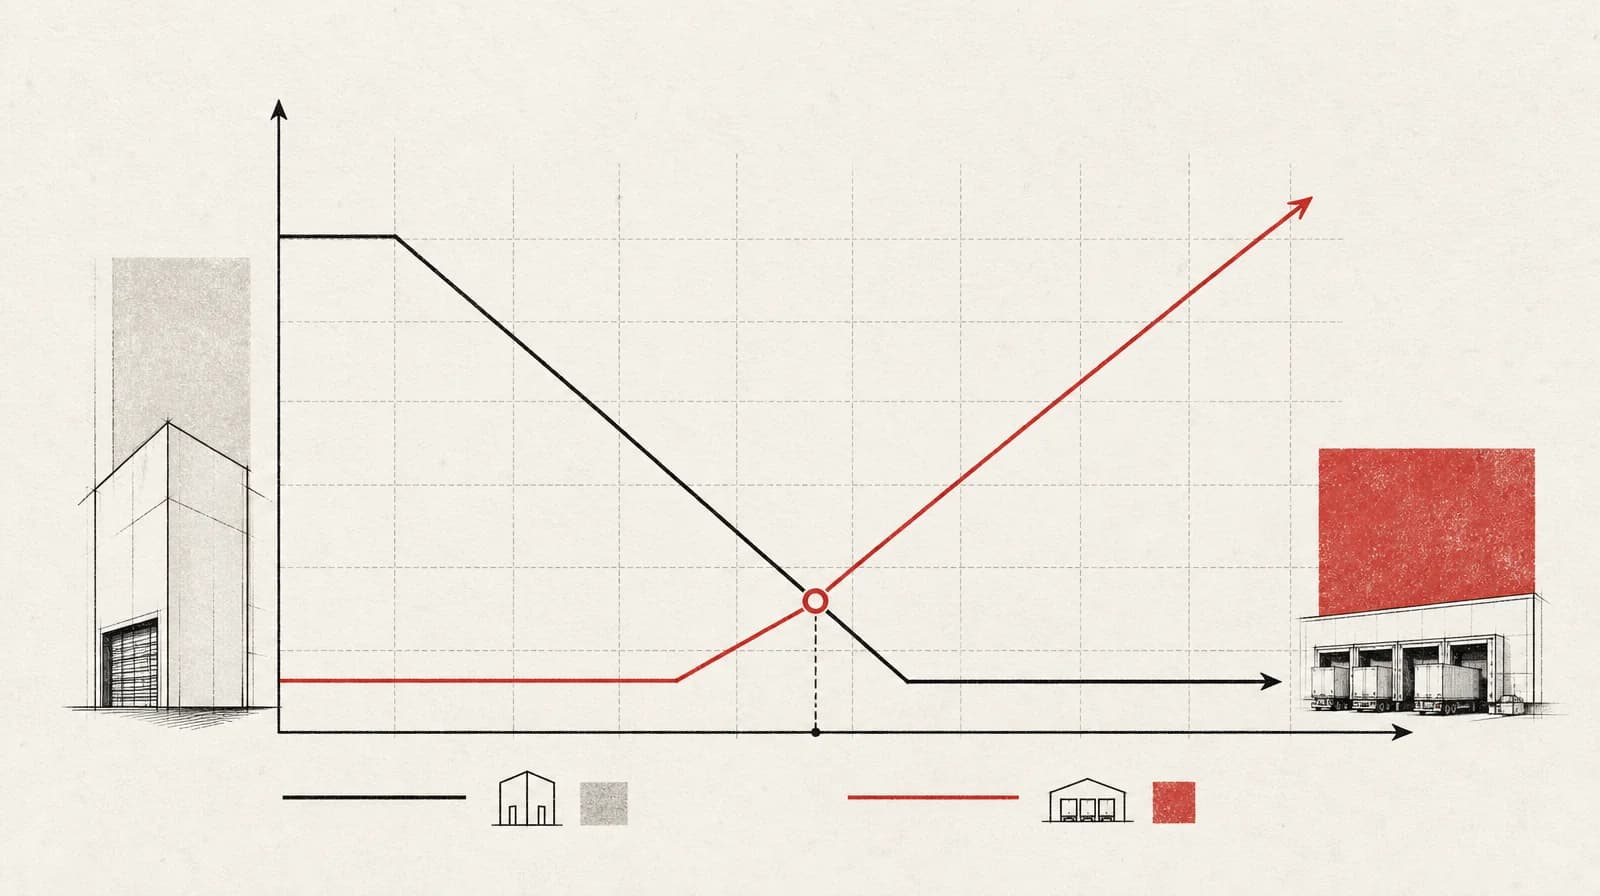
If the columns disagree, follow the shortage that bites inside that horizon.
A scorecard or a promotion will not name the stage.
Use your own lead time, landed cost, cover, fulfilment cost and return recovery.
Rank the pounds you can still change
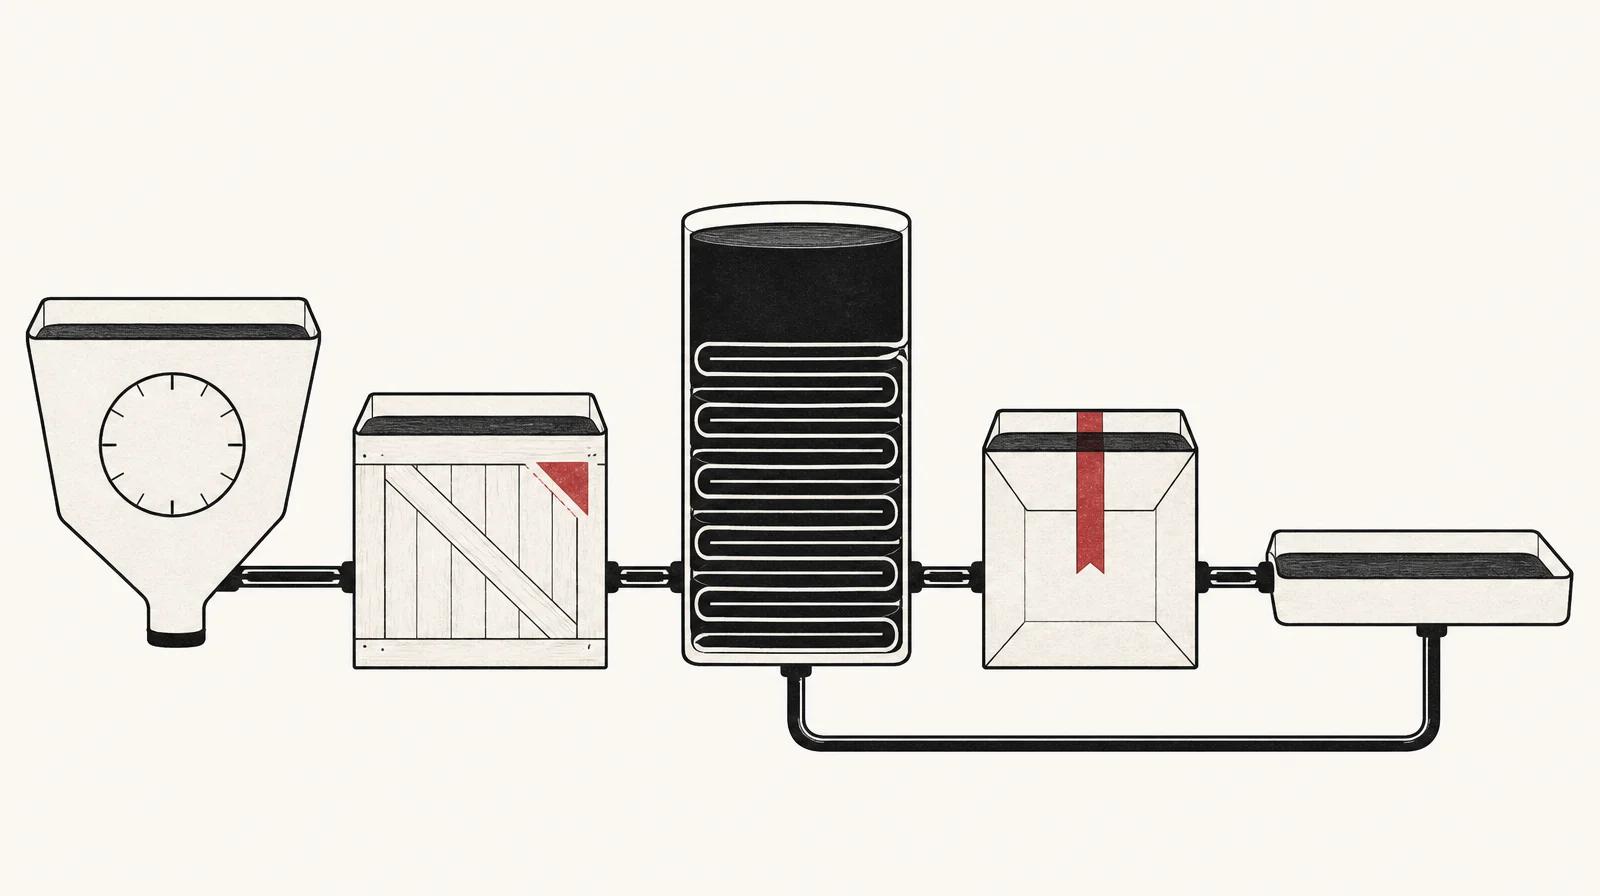
You can see the supply chain hurting margin or tying up cash, and you still cannot tell which stage to fix first. On a horizon you name, rank the stage with the most cash you can still release, or the most contribution you can still protect. Supplier lead time, landed cost, cover, fulfilment and returns can all look wrong in the same month. Do not work through them in the order the pain shows up.
Netstock, an inventory-planning vendor, notes that retailers often face more than one supply-chain problem at the same time.
What a scorecard and a promotion leave out
PerformanSC, a consultancy, describes retail performance across speed, reliability, quality, cost and flexibility, and describes the retail model as demand-driven and consumer-facing. A scorecard of those five can tell you the operation is slow, or expensive, or both. A poor speed score can come from a late supplier or from a stockout that splits the shipment. The scorecard records the speed either way, so it does not name the stage that holds the cash.
A promotion is a weak clue for a different reason. enVista, also a consultancy, puts fluctuating demand down to special offers and volatile consumer trends. The offer changes the demand plan, the units you now expect to sell. The purchase cut comes later: how many units you actually order once the minimum order quantity, the quoted lead time and the cover you are willing to fund are on the table. Replenishment still has to follow velocity. Netstock says a top seller may need frequent replenishment, while a slower product may need only an occasional review. Raising every purchase cut because a sale lifted the demand plan commits more cash on every product you raise. On the slower product, that extra cash is excess stock when the sale did not also lift its demand. Building the demand plan is a separate job from this ranking.
Your own figures, not a borrowed return rate
In its October 2025 release on the 2025 Retail Returns Landscape, the National Retail Federation reported a retailer estimate that 15.8% of annual sales would be returned in 2025, totalling $849.9 billion. The retailer sample for that estimate was 358 ecommerce professionals at large US retailers with revenue over $500 million. The same release gives 19.3% of online sales as the report's estimate, and it does not name that figure's respondents. These are estimates rather than measured return rates. The 15.8% sample does not represent small or mid-sized D2C brands, and it is not a UK figure. Use your own return rate rather than either figure.
The same NRF release says its consumer survey included 2,006 people who had returned at least one online purchase within the past 12 months. It reports that 82% of those shoppers cited free returns as a major consideration when making a purchase, up from 76% the year before. The survey is not a UK sample, and the figure does not tell you what your own conversion would do if you tightened returns. The release also says the report found that 9% of all returns are fraudulent. It does not say how that 9% was measured or which respondents it covers, so it is not an audited rate for your ledger.
Do not rank a published return rate. Appriss Retail's share of sales across its own client base, as described by 3PL Insider, is a different method from the NRF estimates, and neither is your figure. Use your own rate by SKU and by channel, plus the net cash you recover when a unit comes back.
One check at each stage
Use numbers you already have. One check is enough to rank.
For supplier lead time, compare actual receipt dates with the dates quoted across the last few purchase orders, and use the spread. One late order does not change the buying decision unless that spread is widening. You will hit a visibility limit quickly. Amazon Business puts it as: "Most retailers can see their primary suppliers clearly but know little about the upstream providers those suppliers depend on." Plan around the suppliers you can time. That description is not a measured rate to put in the rank. If you do not have a date for the provider behind your supplier, leave it out. A guessed cause should not delay the ranking.
For landed cost, compare actual landed cost per unit with the cost in the purchase plan. Keep open shipments separate from paid ones. A paid gap explains margin you have already lost. Only an open gap is avoidable on a short horizon.
For cover, divide units on hand by expected daily sales, and do it by SKU. Check slow movers, a warehouse that is filling up, and repeated markdowns, and check stockouts on the top sellers in the same pass. An average can look calm while the hero is out and a side colour is ageing. One cover target for the whole catalogue will not show you which of those is tying up the cash.
For fulfilment, divide cost per order by average order value, and include the cost of split shipments. That cost share is the check. Amazon Business notes that appetite for shipping speed rarely comes with a matching willingness to pay for it, so a promise-time target is not a substitute for the invoice.
For returns, take the return rate by SKU and by channel, then the net cash recovered on a returned unit after the refund, the label and the price you actually resell at. Split the gross rate into what you can still avoid and what you cannot. Make that split from your own tags. A fraud share from another returns report will not do it for your ledger.
Rank one horizon, and count lead time once
Name the horizon before you compare stages. Use a window in which you can still act: the next 90 days, or the next purchase order if that is the decision in front of you. Then rank by the cash you can still avoid committing or still release, or by the contribution you can still protect.
Pick one line. If the business is short of cash, rank cash. If suppliers are being paid and the pain is margin, rank contribution. If both are tight, the two rankings can disagree. A markdown can bring cash in and spend contribution in the same week, and there is no average that settles the tie. Choose the shortage that bites inside the horizon, and write down which one you chose.
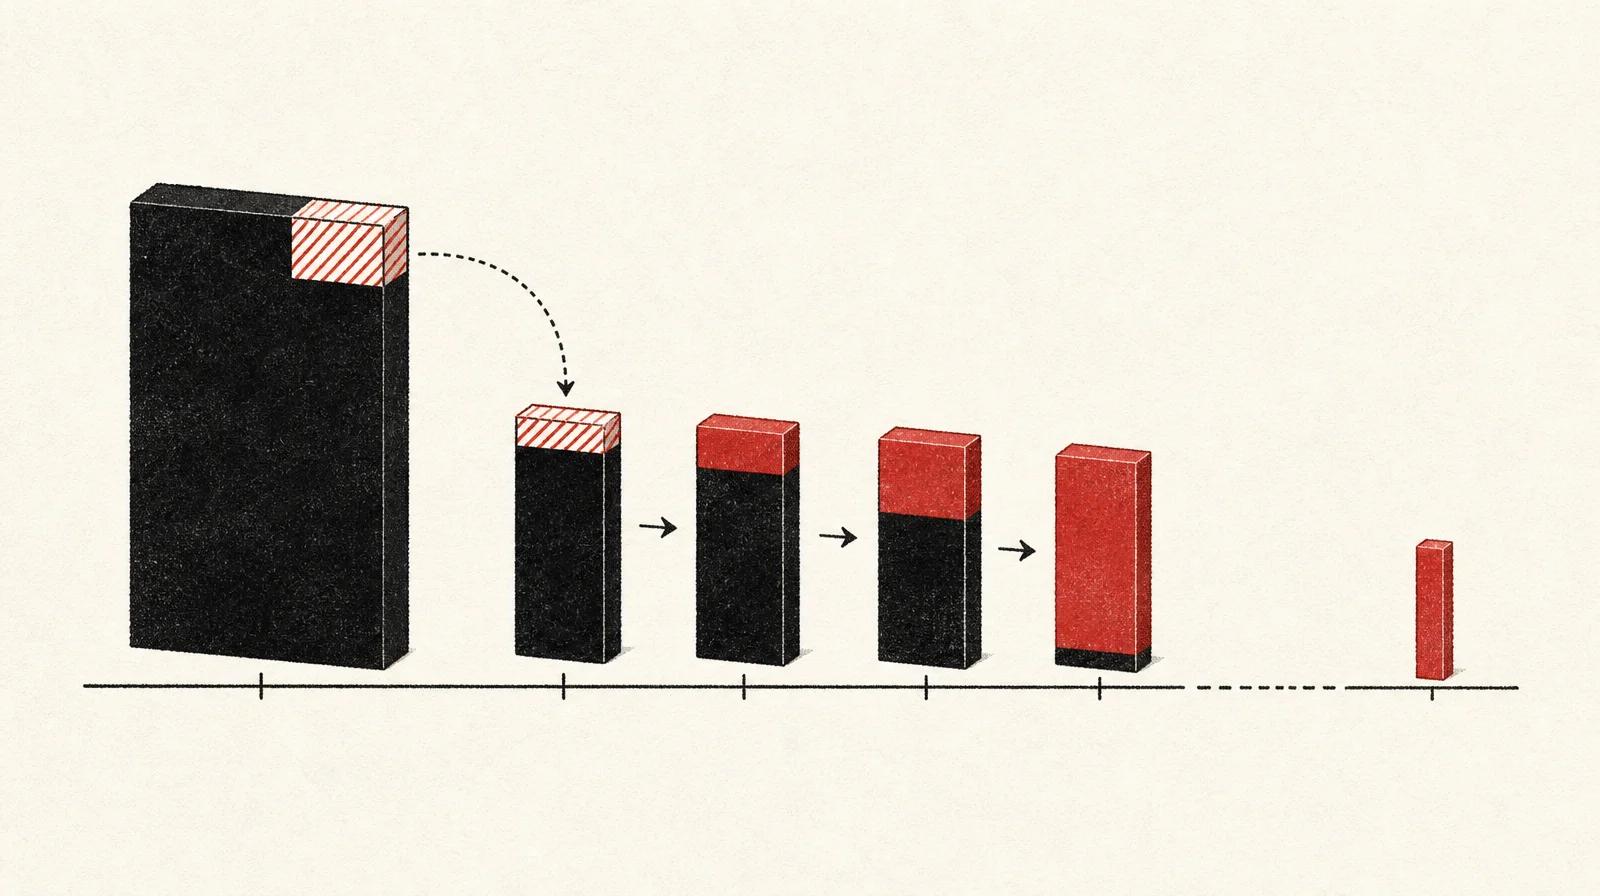
Count a lead-time effect once. Variable lead time is a reason to buy earlier and hold more cover. That extra cover is the same cash as the early purchase. If the purchase order is still open, the avoidable amount sits with the supplier decision: do not place the excess, and do not also book a future stock win for units you have not bought. If the goods are already in the building, the supplier stage has no cash left to free on this horizon. The only avoidable amount is what you can still get out of that stock. Adding the early buy to the cover it created counts one decision twice.
A 90-day example in invented pounds
The figures in this section are invented, and they are in pounds, so the arithmetic can be checked. They are not a conversion of the US return estimates, and they are not a result from any brand.
The horizon is 90 days. Suppliers are being paid, so the ranking line is contribution. Cash is kept alongside as a check. Expected orders are 800. Average order value is £40.
The slow colour has a minimum order quantity of 300 units at £12 landed, so a full order is £3,600. The hero, the faster-selling product, is not on this order. The 90-day demand plan for the slow colour is 60 units. The other 240 units, the excess, are £2,880. The purchase order was accepted 8 weeks ago. Quoted lead time was 4 weeks. The last four receipts against that quote were 4, 5, 5 and 7 weeks. This order is the 7-week receipt, so it arrived a week ago and the goods are in the building. Avoidable cash at the supplier stage on this horizon is £0. Because those goods are already stock, the £2,880 does not get a second score under cover.
The 60 units in the demand plan sit outside those 240 excess units. They sell at the full price of £28, and that sale was already planned, so it does not release extra cash. Of the 240, assume 20 would sell inside the horizon at £22 because of a £6 markdown. Cash in from that markdown is 20 x £22, which is £440. Those 20 are excess units, so they would not sell at £28 inside the 90 days. The £6 gap is not contribution given up on this horizon, and it does not enter the rank. Assume you have no test showing a deeper discount would stay on the slow colour rather than pull the hero price down. The other 220 units then have no tested way out, so they are not avoidable cash on this horizon. On the cash line, the markdown frees £440, and only that.
On the hero, landed cost was £11.40 a unit in the plan and £12.20 on the invoice. The £0.80 gap on the 200 units already received is £160. The invoice is already paid, so that £160 is margin lost before this horizon, and there is nothing left to avoid or put in the rank.
Fulfilment cost is £6 an order, 15% of the £40 average order value. Inside 90 days you can stop splitting the hero from a small add-on. That saves £0.50 an order. On 800 orders, that is £400 of contribution, and £400 off the carrier bill. Pressure for faster shipping does not increase that £400. The avoidable gap is the split you can actually stop.
The 800 expected orders are sales still to come inside the 90 days, not a draw on the 200 hero units already received and invoiced. Assume each of those orders contains one hero unit. At 15% of those 800 units, this illustration has 120 returns. That 15% is the invented brand's own rate. Assume the ledger shows a net shortfall of £15 a return versus a kept sale, after the refund, the label and the resale price. The gross leak is 120 x £15, which is £1,800. Assume 60 of the 120 are already tagged as size-guide errors on one size, rather than a change of mind. If those 60 are not tagged, the avoidable portion of the £1,800 is unknown, so you should not rank the gross figure.
If the size-guide fix is live from the first day of the 90 days, and those 60 tagged orders still complete as kept sales, correcting the guide avoids the returns. Pulling that size from ads can remove the orders instead of turning them into kept sales, so count 60 x £15, which is £900, only when the orders remain. That £900 is contribution you can still protect. Stopping the split shipments protects £400 of contribution as well. The markdown frees £440 of cash. It is not contribution given up against a £28 sale, because those 20 would not have sold at £28 inside the horizon. Against leaving them unsold, the same 20 add £10 of contribution each, £200, on the £12 landed cost. That £200 still sits behind returns and the carrier saving, so returns rank first on the contribution line. Supplier and landed cost have nothing left to change this quarter.
In these invented figures, and on the assumptions above, the £900 is contribution. It is also cash inside the horizon only if the kept-sale receipts, and the refund, label and resale you would otherwise have booked, all fall inside the 90 days. On that timing, returns lead on cash as well: £900 against £440 from the markdown and £400 from the carrier. The winner does not flip here. Yours might, if a clearance can move more of the 220 units still unsold without pulling the hero price down. Rerun the cash column before you lock the rank, and count that clearance only when your own figures support it.
If the slow-colour order were still open, assume the supplier would have accepted 60 units. The £2,880 you would not commit would lead the cash column, without a second score as stock, but it would stay out of the contribution ranking against the £900. The order is already accepted, so that cash is no longer avoidable at the supplier stage.
The £900 counts only if you can ship the size-guide fix inside 90 days and the orders remain kept sales. Ending free returns is a different decision, and this example does not price it. The NRF consumer survey already cited, of shoppers who had returned at least one online purchase, is not your customer base and is not a UK result. That limit is enough to stop you treating a policy change as free contribution.
Where the winning stage goes
Returns won on the contribution line in the example, so the next page is judging SKUs on CM2. Before more paid spend goes behind the size that was driving those returns, use whether that product can afford paid acquisition. If your own ranking puts an open purchase order first, go to demand planning and supply planning. If the carrier gap is the largest avoidable pound, go to the choice between a 3PL, owned fulfilment or a hybrid.
Sources
- Consumers Expected to Return Nearly $850 Billion in Merchandise in 2025 (NRF press release, October 15, 2025) nrf.com NRF attributes the 9% figure only to 'the report' (the 2025 Retail Returns Landscape). This sentence does not tie it to the 358-ecommerce-professional retailer sample, to large US retailers or to any other respondent group.
- NRF press release: Consumers Expected to Return Nearly $850 Billion in Merchandise in 2025 (About the Survey) nrf.com Primary replacement for the failed Retail TouchPoints link. NRF's own release says the consumer survey in the 2025 Retail Returns Landscape covered 2,006 consumers who had returned at least one online purchase within the past 12 months.
- What is the average ecommerce return rate? 3plinsider.com Appriss Retail models transaction-level data across its retail client base and reports returns as a share of all retail sales.
- Retail supply chain management: strategies and best practices business.amazon.com A retail supply chain must absorb demand swings without stranding cash in inventory.
- The supply chain in the retail industry: challenges, trends and opportunities performansc.com Performance is described across speed, reliability, quality, cost and flexibility.
- Retail supply chain optimization: How SMBs build faster, leaner, more resilient operations netstock.com Netstock, an inventory-planning vendor, says how often stock is replenished or reviewed can differ with product velocity: a top seller may need frequent replenishment, while a slower product may need only occasional review.
- Retail supply chain management: shipping strategies for growing retailers wwex.com Demand volatility, omnichannel fulfilment, high SKU counts and customer delivery expectations create constant pressure on shipping operations.
- What is retail supply chain and when should you optimize? envistacorp.com Fluctuating demand is attributed to special offers and volatile consumer trends.